the Kalamazoo Walmart Live or Die Scenario
(a linear regression will tell them their fate)
Here's the situation. Herman, Frank, and Arnie have been working at the Kalamazoo, Walmart for what seems like most of their lives. The store is almost a second home to the "Wally Boys" as they've become known.

Arnie, Frank, and Herman
Working at Walmart is not just a job to these three, it's a passion. They are hard core employees. They've been there so long that they can do anything in the store from cart retrieval to checkout. Arnie even had a brief turn one week in the women's lingerie area. He found he really enjoyed helping women of all ages find that "perfect" bra.
Unfortunately, the Walmart headquarters is on the verge of closing this branch of their chain. The Texas executives say that the Kalamazoo store is not bringing in enough money to justify its existence. They continue to quote the Walmart creed, "12 million a year or you DIE!"
Well the "Wally Boys" don't want to live a life without Walmart, so they take it upon themselves to start a "SAVE OUR STORE CAMPAIGN". They are pulling every trick in the book to get people into the Kalamazoo Walmart. They are having free car washes, bake sales, and a circus day. They even have all the female employees dress like the famous Kalamazoo Zebra's in their football outfits, complete with shoulder pads and headgear. The male employees all come dressed as Kalamazoo Zebra's Cheerleaders every Friday. Boy it's funny seeing Frank with his fat belly wearing a short, black and white, striped, chearleading skirt. Actually quite a few people come out for that.
Herman, who is the more mathematical of the three, decides to take some hard data and run a regression to see if they will have their beloved Walmart at the year's end. He tallies the store's income for a period of six days and records his data in the chart you see here:
|
end
of day
(d) |
total
$ accumulated
(m) |
|
1
|
10,592 |
|
2
|
70,281
|
|
3
|
122,003
|
|
4
|
138,622
|
|
5
|
170,515
|
|
6
|
204,598
|
Step 1: Set up and label your graph. Don't forget to give it a title. You will need to decide upon a scale that will comfortably fit your data points. Then graph your data.
click HERE to print out some graph paper
Step 2: Draw your line of best fit.
Step 3: Select two points on your line of best fit and write their coordinates below.
| (_____, | ______) |
|
x1
|
y1
|
| (_____, | ______) |
|
x2
|
y2
|
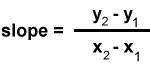
Step 4: Find the slope
between these two points. Show your work here.
Step 5: Substitute one of your points and the slope you found into y = sx + i, and solve for the y-intercept, i. Show your work below.
Step 6: Finally write your equation here:___________________________.
Questions:
- Do you think Herman's data,
taken over a period of six days, is a good example of the money that
would come in each day for the entire year? (why or why not)
- What events might cause
the daily amount of money taken in to drop or rise throughout the year?
- Use your equation to figure
out how much money the store will bring in during a 365 day year. Show
your work.
- How many days will it take
to make the $12,000,000 needed for the store to stay open? Show your
work.
For more work
with regressions check out these: day
1 activity |
day
2 activity | day 3 activity | day
4 activity | Barbie Bungee
Activity
Home | About
Us | Algebra| Dictionary | Games | Geometry | Gym | Humor | Lab | Magic | Natural Math | PreAlgebra | Resources | Teachers Only | Toolbox | Treasures | Videos | Wonders | Writings |
Copyright © 1999-2020 themathlab.com