The Rectangle Family Comparison
The Rectangle family: Arthur, Fred, Marla, Jenny, Spike, Pinky, and Otto welcome you to their home on the Internet. You can tell that they are all in the same family because they all have the same width, or height if you prefer. Each family member has their own individual length however and thus the AREA of each rectangle is unique.
HINT: the area of any rectangle is found by multiplying its length by its width, or height if you prefer to call it that. A = Lw
As a family project, they decided to see if their lengths compared to their areas was a linear relationship. Follow the steps below to find out. You can print this paper or do the activity on your own paper.
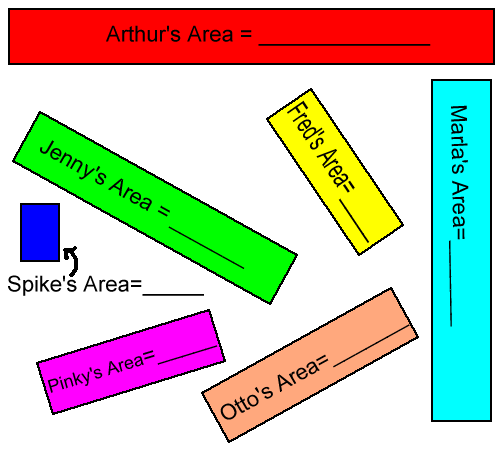
Step 1: First you need to get your ruler and measure all the lengths to the nearest tenth of a centimeter, write them down, and then figure out the area for each rectangle and write it in the rectangle.
Step 2: Now organize this data into a table of ordered pairs with the "l" column representing the length, and the "a" column storing the area.
|
Length
(l) |
Area
(a) |
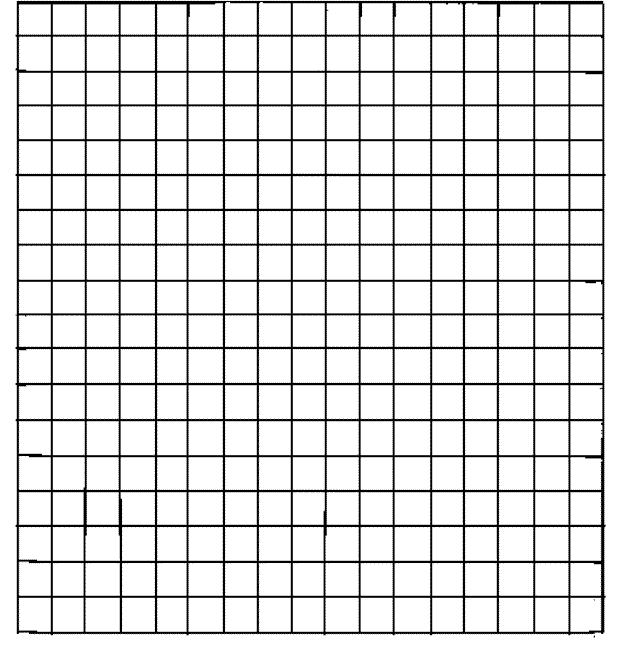
Step 3: Now take your graph paper and set up a grid on which all of these data points will fit. ( Be sure your scale is uniform. That means that each block on a given axis must represent the same amount.)
Be sure to give your graph the title: Rectangle Family Comparison of Length and Area.
Also label your "x" axis, Length in Centimeters and your "y" axis Area in Square Centimeters.
Step 4: Now Graph each of the seven data points. You will have to estimate a bit as you decide where each point belongs.
Step 5: Draw in your line of "best fit". You may use the least squares analyzer if you like.
Step 6: Select two points on your line and write their coordinates here:
| (____ | , | ____) | , | (____ | , | ____) |
|
x1
|
y1
|
x2
|
y2
|
Step 7:
Find the slope between these two points using the formula 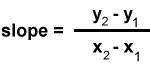 , show your work above.
Write the result here:_________________________ .
Step 8: Now substitute what you know into the slope-intercept equation
y=sx+i, and solve it for 'i'.
Step 9: Now that you know the slope, (s), and the y-intercept, (i), for your line, write its equation here: _____________________________
QUESTIONS:
- Based upon your equation,
what would the area be of a rectangle the same height and 15 meters
long?
(NOTE: Remember to change 15 meters to centimeters because your equation is calibrated in cm.)
Show your work below.
- How long would your rectangle have to be to have an area of 1,000,000 square cm? Show your work below.
For more work
with regressions check out these: day
1 activity |
day
2 activity | day 3 activity | day
4 activity | Barbie Bungee
Activity
