NOTE: Math folks are always trying to describe the stuff that happens in real life with numbers. They believe you can find an equation for just about everything!
Linear regression is the process of finding a linear equation to describe real life situations that increase or decrease in a line. Lots of things out there do!
Here's a recipe for finding the equation:
- Gather data points
- Graph them
- Draw your "line of best fit"
- Select two points on the line
- Find the slope between the two points
- Use the slope and one of the points to find the equation
Once you have the equation,
you can make predictions about what will happen in the future or even
what happened in the past.
![]()
Let's look at an example that we like to call THE SECRET, MESSAGE, WHISPER, CHAIN.
Did you ever play that game
when you were a kid where you whisper something into someone's ear and
then they whisper the message to the person beside them and then that
person whispers the message to the person beside them and so on until
you get to the end of the chain?


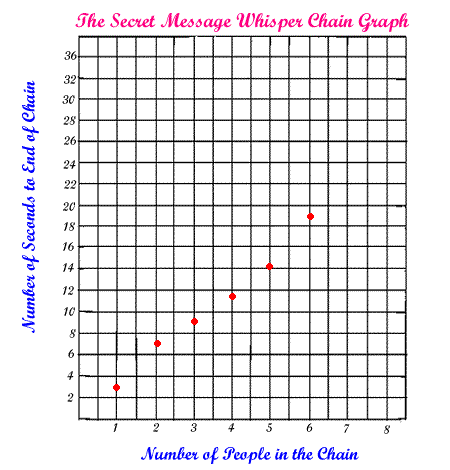
We recently played this game with six people. We recorded the time it took to reach the end of the chain for only one person being told, then for two people passing it on, and then for three, four, five, and six. It took longer each time we added a person, and we thought that maybe an equation could describe the process, so we did a regression.
It turns out we were right. You can describe this process with an equation. Look at the steps below to see what we did. Then give the activities on the next few days a try.
|
Step
1
|
First we gathered all the data and put it into a little table of ordered pairs. Always be sure to label your table so you know what the numbers stand for.
|
||||||||||||||
|
Step
2
|
Second
we got some graph
paper and set up a grid that would fit all of our data points
with a bit of room left over. Then we gave the graph a TITLE
and we described the numbers on the x and y axes, this is called labeling,
so that anyone reading our graph would know exactly what the points
meant. Then we graphed all six data points.
|
||||||||||||||
|
Step
3
|
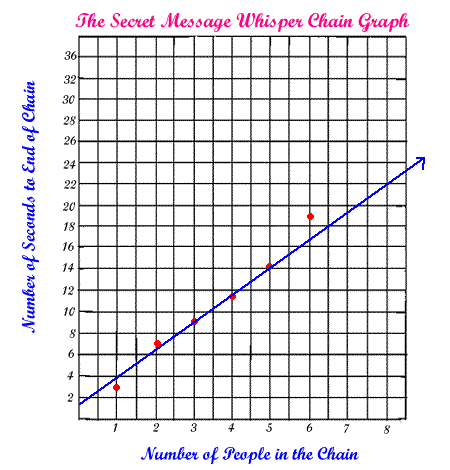
Sometimes data points will be scattered all over a graph, and they don't seem to follow any pattern, these are called random points. But in this case, we noticed that the points had some order to them. They looked like they were trying to form a line. This made us believe that there was probably an equation that would describe this whisper chain situation. If we could only find the best line! So we experimented a bit using the least squares regression tool, until we found a line that seemed to describe the pattern of the data best. In general if you are doing this manually we recommend a ruler or a piece of uncooked spaghetti. Slide the spaghetti string or ruler around until you feel you have the same number of data points above the line as you have below it. Often you can find a line that actually passes through two, or three, or more of your data points. Mathematicians
call this line the "line of best fit". When found
with a piece of spaghetti or ruler it is at best still an estimate,
but it's usually good enough to generate a reasonable equation.
Below is a picture of the line we chose. *NOTE: Two people finding a line of best fit may not always come up with the exact same line, but they should be reasonably close. |
||||||||||||||
|
Step
4
|
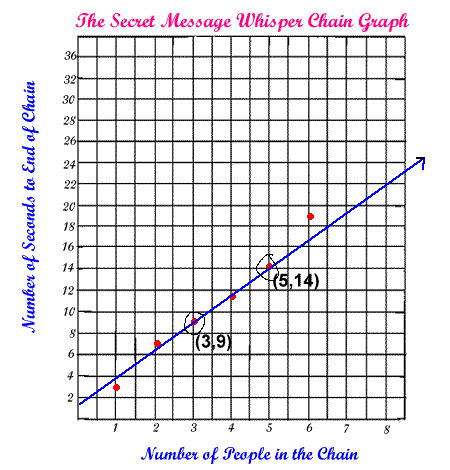
Next we looked carefully at the line and selected two points. We circled and labeled them. You can pick any two points on the line, but it's best to pick two points that are on a grid intersection or ones for which you know the coordinates from data points. Our line passed through
three data points, so we chose two of them, (3,9) and (5,14). |
||||||||||||||
|
Step
5
|
Now we were ready to get that equation. All we needed was the slope and the y-intercept, so we started with the slope. The first point was (3,9)
and the second was (5,14), so we plugged these values into the slope
formula: |
||||||||||||||
|
Step
6
|
Next we substituted this slope into the "slope/intercept" form of the equation, y = sx + i, remembering that the spot where the letter "m" sits is where the slope of the line belongs. So now our equation looked like this, y = 2.5x + i.
The last thing we needed was the value for the y-intercept, which is always stored in the variable "i". To find it, we had to select either one of our two points in Step 4, and then substitute the x and y coordinates from this point for x and y in the equation in Step 6. We used (3,9) because
we thought it looked easier, and when we substituted 3 for x
and 9 for y the equation looked like this:
|
||||||||||||||
So the slope is
2.5 and the y-intercept is 1.5. Which means the equation
for this situation is,y
= 2.5x + 1.5
where x stands for the number of people in the chain and y
stands for the time it takes to tell the secret to all those people.
Now that we have the equation, we can play "WHAT IF". We can determine how long it will take for any number of people to run the Secret Message Whisper Chain. Or if we know the time allowed, we can determine how many people can be in the chain.
Try to use the equation to answer the following two questions.
- How long
will it take 100 people to pass the message?
(answer)
- How many
people could hear the message in 1 hour?
HINT: The equation is calibrated in seconds, so you will need to enter how many seconds are in an hour to get the right answer.
(answer)
day 2 activity | day 3 activity | day 4 activity | Barbie Bungee Activity
Home | About
Us | Algebra| Dictionary | Games | Geometry | Gym | Humor | Lab | Magic | Natural Math | PreAlgebra | Resources | Teachers Only | Toolbox | Treasures | Videos | Wonders | Writings |
Copyright © 1999-2020 themathlab.com


 and we got
 which
equals 2.5.