d5

The line graph shows the mean temperatures for January, April, July, and October in Whoville and on Grinch Mountain. Use the graph to answer the three questions.
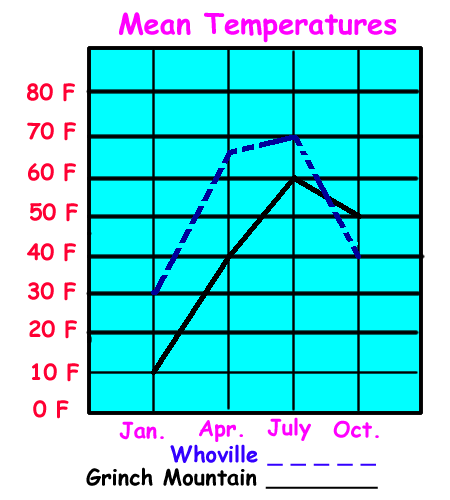
A.) How many degrees warmer was it in Whoville than on Grinch Mountain during the month of April?
B.) During what month did Whoville and Grinch Mountain differ the most in temperature?
C.) What was the mean temperature on Grinch Mountain for the months of July and October?
![]()
Home | About
Us | Algebra| Dictionary | Games | Geometry | Gym | Humor | Lab | Magic | Natural Math | PreAlgebra | Resources | Teachers Only | Toolbox | Treasures | Videos | Wonders | Writings |
Copyright © 1999-2020 themathlab.com