GRAPHING LINES
click HERE for worksheet
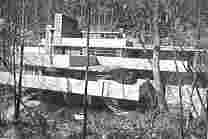
| The architect Frank Lloyd Wright used straight lines in many of his
buildings. In fact, he seemed to have a love affair with the straight line. If you examine his work, you will see the use of straight line in almost everything from roofs to foundations to windows to furniture to lamps. Below are a few pictures from "Fallingwater", a home built near Uniontown Pennsylvania. This home is built overtop of a small waterfall, thus its name, Fallingwater.
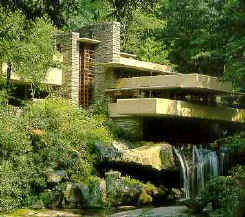
This home was built as a summer home for the Kaufmann family of "Kaufmann's" department stores in 1935.
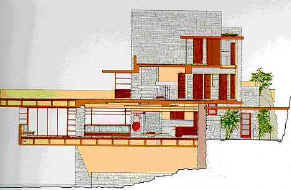
The architect, Frank Lloyd Wright, used a great deal of concrete and native stone to create a dwelling that seemed to "grow" from the surrounding hillside and rocks.
Extensive use of horizontal line was integrated into the plan. Even the rocks used in the foundation and sidewalls are horizontal in design.
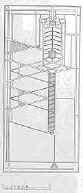
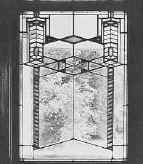
Mr. Wright designed almost everything inside and outside of his houses. Below, we see that he chose to "decorate" with the use of diagonal lines for windows.
These diagonals added interest to the strong horizontal and vertical lines in the shells of his homes. NOW MATHEMATICALLY SPEAKING: It's rather interesting to know that all straight lines can be described with EQUATIONS. They are called linear equations. Linear equations can always be arranged in the form y = mx + b. Here are some examples of linear equations:
One way of graphing these linear equations is to set up a table of values. Here is an example: Suppose you want to see the line described by y = 2x + 1.
Then we graph these values, and it will look like this:
Click HERE for some practice on graphing.
|
Copyright © 1999-2020 themathlab.com  |