VS.

It has recently come to our attention that some people believe children learn and recall math facts better when they are presented on a circular medium.

We here at themathlab.com are still not sure whether this is true, but we think that a bit of data gathering and analysis may be enlightening.

So if you're curious, come on along and try the following activity with a bunch of your friends.


  1. Gather some people for the experiment. Ten or more is best, and they can be different ages as long as they can read numbers and have learned or are learning how to multiply. Then pair them up.

  2. Print out our decks of cards here: CIRCULAR and RECTANGULAR.
    Each pair of people will need both decks.


  3. Starting with the rectangular deck, have your friends take turns flashing the decks to each other for one minute per deck. Use a timer and let each pair flash at the same time. The person who is flashing will wait until the other person either answers or says "pass." All correctly answered cards will be laid to the right. Wrong or passed cards will be laid to the left.

  4. After the rectangular deck, relax a bit and then have them flash the circular deck to each other.

    Be sure that each person records how many facts they got correct for each deck on their record sheet.

  5. After all the groups have their data, tell them what this is all about. Tell them that arranging all the data might help us to see if there is an answer to the question, "Are circular flashcards better?"

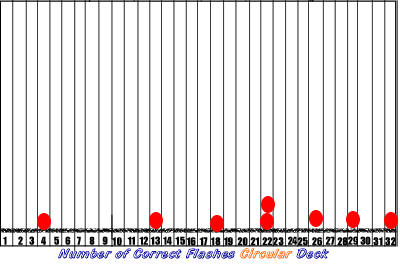
  6. There is a spot on the record sheet for you to record all of the folks' data into two bar graphs, one for the circular cards and one for the rectangular cards.

    If you put the same size dots above the numbers as shown below, you will get a bar graph that will begin to give you a feel for how the group did as a whole.

  7. This is not the only way to display the information however and there is another graph type called a "box and whisker plot" which looks pretty cool and can tell you a bit about the middle scores.

    To make a box and whisker plot read the following:


Copyright © 1999-2020 themathlab.com


Google